Printable Texas Hold’em Chart for Quick Decision-Making
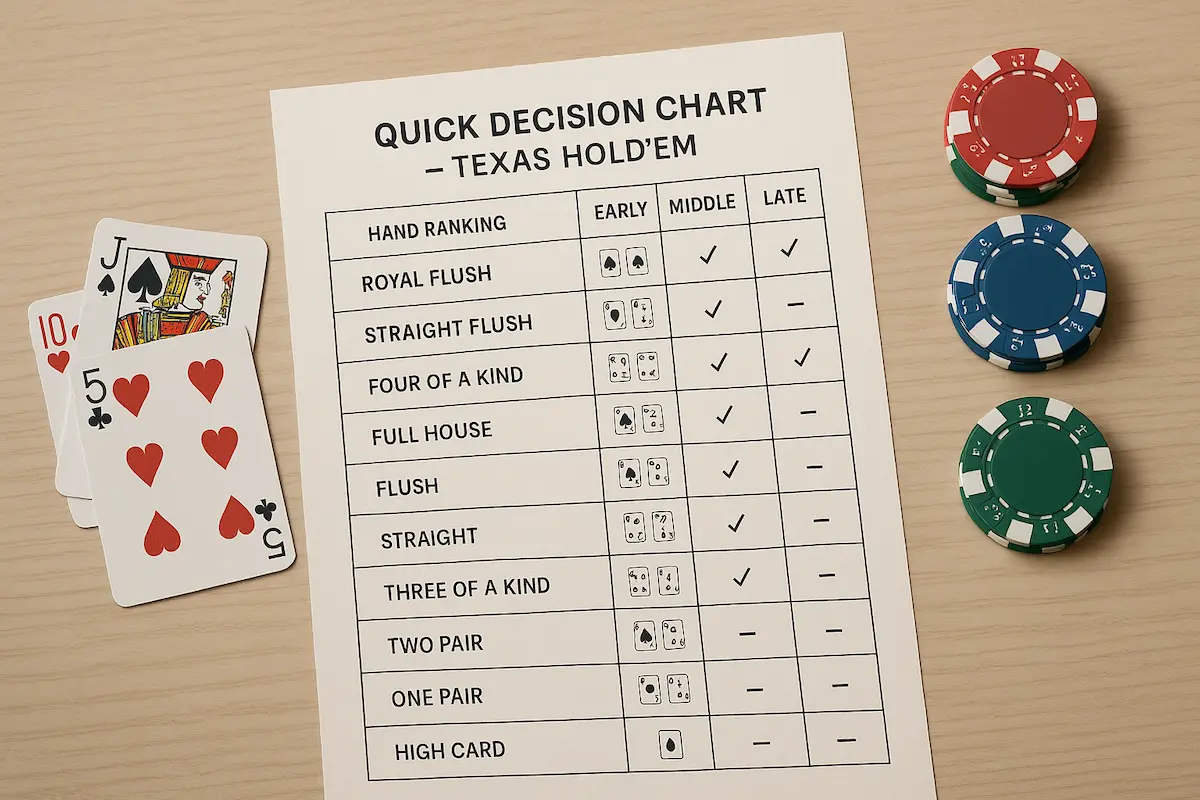
Texas Hold’em is a game of skill, timing, and calculated risk. Whether you’re a recreational player or a competitive grinder, knowing when to fold, raise, or shove can make all the difference. This is where Texas Hold’em charts come into play. These powerful visual tools help players understand starting hands, position strategy, odds, and pre-flop/post-flop decisions. Even better? Many of these charts are available in printable format, making them ideal companions for both online and live play. In this guide, you’ll learn everything you need to know about Texas Hold’em charts, how to use them effectively, and where to find the best printable versions to improve your game. What Are Texas Hold’em Charts? Texas Hold’em charts are reference tools that organize crucial poker information into simple, easy-to-read formats. They’re designed to assist players in making optimal decisions at various stages of a hand, especially during the pre-flop phase. There are several types of Texas Hold’em charts, including: Starting Hand Charts Position-Based Action Charts Push/Fold Charts for Tournaments Odds & Equity Charts Post-Flop Decision Trees Each chart has a specific use case and helps streamline your strategy during real-time gameplay. Why Use a Texas Hold’em Chart? Poker is a game of incomplete information, but using statistical and positional data improves your edge. Charts help by: Eliminating guesswork Encouraging mathematically sound play Reducing mistakes under pressure Helping beginners build muscle memory Speeding up decision-making during timed online play If you’re looking for a fast track to smarter poker, especially pre-flop, Texas Hold’em charts are essential tools. Texas Hold’em Starting Hand Charts The most common chart is the Starting Hand Chart, which shows which hole cards to play and from which position. These charts are usually displayed in a 13×13 grid, with all possible two-card combinations categorized as: Pocket pairs (e.g., AA, 77) Suited hands (e.g., A♠K♠) Off-suit hands (e.g., K♥Q♣) Example Starting Hand Chart Breakdown: Rank AA AKs AQs AJs ATs … KK AKs KQs KJs KTs … QQ AQs KQs QJs QTs … Legend: Green: Rise from any position Yellow: Play in late position Red: Fold These color-coded Texas Hold’em charts give players an instant snapshot of hand strength based on position. For an excellent interactive chart, visit Upswing Poker’s Pre-Flop Hand Chart and download your own printable copy. Printable Texas Hold’em Charts: Benefits and Use Cases While many poker tools exist online, printable Texas Hold’em charts remain incredibly useful. Here’s why: 1. Easy Offline Reference Whether you’re at a live home game or playing without access to digital tools, a printed chart is always ready. 2. Great for Beginners Print it, tape it next to your monitor, and use it as a cheat sheet during your learning curve. 3. Faster Learning Visual repetition boosts muscle memory. Having the chart in front of you reinforces good decision-making. 4. Tournament Prep Charts like push/fold guides are critical when short-stacked in tournaments. Having one printed out gives instant access without tabbing out of a game. Download tournament push/fold charts for MTTs and SNGs from PokerStrategy.com Position-Based Charts: Why Position Matters In Texas Hold’em, your seat at the table determines the strength of your playable hand range. Position-based charts factor in where you’re seated: Early Position (EP): Tightest range. Only play premium hands. Middle Position (MP): Add more hands like suited connectors. Late Position (CO, BTN): Looser range. Steal blinds with wide variety of hands. Blinds (SB/BB): Mix of defense and tight-aggressive strategy. Sample Position-Based Recommendations: Position Recommended Hands Early (UTG) AA–JJ, AKs, AQs Middle (MP) 99+, AJs+, KQs Cutoff (CO) 77+, A9s+, KJ+, QJ+ Button (BTN) Any pair, suited connectors, Ax This approach adds context to starting hands, turning a static chart into a dynamic strategy tool. Push/Fold Charts for Tournament Players Tournament players face a unique scenario—short stacks and increased pressure. This is where push/fold charts become vital. A push/fold chart shows what hands to shove or fold depending on: Your stack size (e.g., under 10 big blinds) Your table position Number of players at the table Example: 8 BB on the Button → Shove with 22+, A2+, K9+, QTs+ 6 BB UTG → Shove only with 77+, A9+, KQ Download printable push/fold charts from PokerNerve Texas Hold’em Odds Charts While hand charts are about what to play, odds charts focus on what you can expect to hit. Common Odds Covered: Hitting a set with a pocket pair on the flop → ~11.8% Completing a flush with 4 suited cards on the flop → ~35% by river Open-ended straight draw hitting by river → ~31.5% One overcard improving vs. small pair → ~30% Having these numbers printed and within reach during post-flop situations can help guide profitable decisions. Check PokerListings’ Odds Cheat Sheet for a downloadable odds table. How to Use Texas Hold’em Charts Effectively Charts are tools, not rules. Here’s how to use them properly: Start With Pre-Flop Play Begin by following hand charts strictly, especially for pre-flop decisions. It builds discipline and consistency. Adjust Based on Opponents If your opponent is loose or tight, modify your chart-based decisions accordingly. Memorize Over Time The more you play, the less you’ll need to look at the charts. Eventually, the chart becomes instinct. Don’t Over-Depend Use charts as a baseline. The best players combine data with live reads, bluff detection, and meta-game strategy. Where to Find Free Printable Texas Hold’em Charts Here are some top sites offering free and reliable printable Texas Hold’em charts: Site Charts Available Link Upswing Poker Pre-flop, Tournament Link PokerStrategy Starting hands, Push/Fold Link BlackRain79 Beginner hand rankings Link PokerNerve Tournament shove charts Link All of these sources provide PDF versions ideal for printing and using at the table or study sessions. Final Thoughts: Charts Make Better Players Texas Hold’em may be a game of luck in the short term, but over time, it rewards players who make consistent, strategic decisions. With the help of Texas Hold’em charts—especially printable charts—you can build a rock-solid foundation that turns guesswork into confidence. Whether you’re playing your first hand or aiming
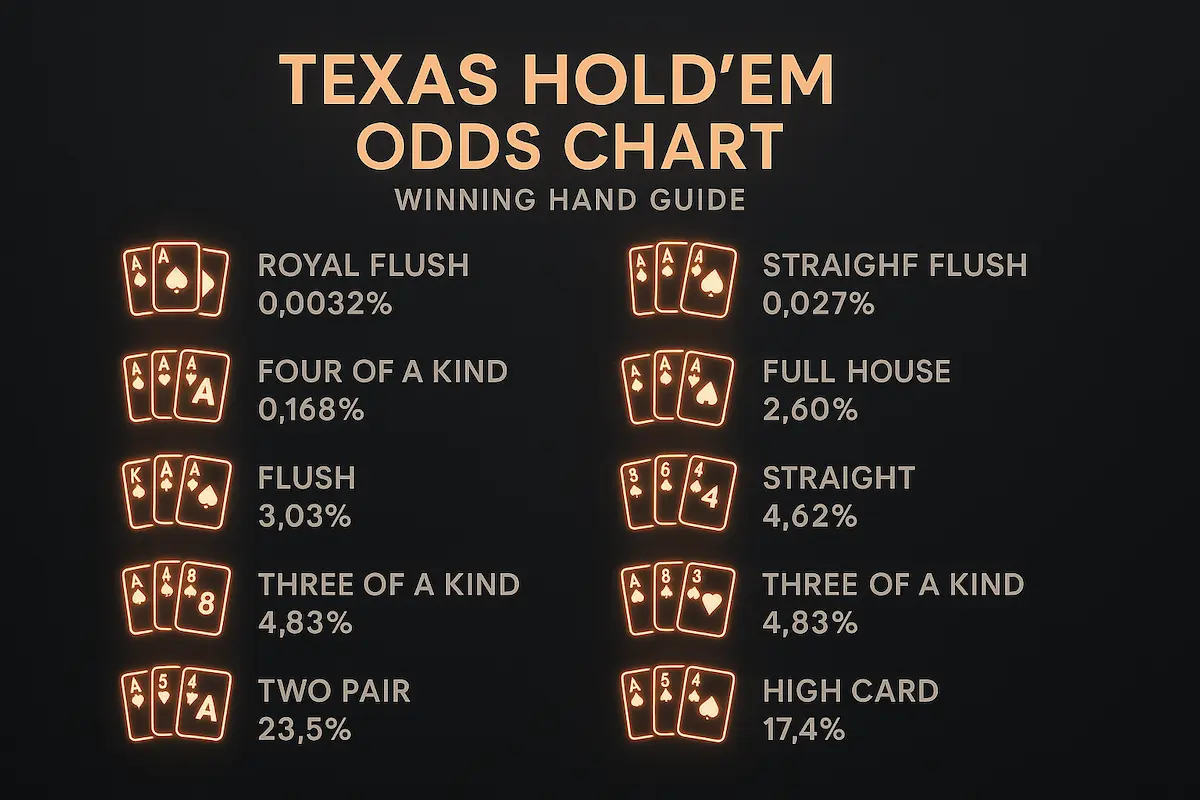
Texas Hold’em Odds Chart: Your Guide to Winning Hands

Texas Hold’em poker is a strategic and mathematical game, where understanding your odds can mean the difference between a winning and losing session. For players serious about improving their game, two resources stand out: the Texas Hold’em odds chart and the Texas Hold ’em chart hands. Together, they form a foundation for making smarter decisions at the table. In this guide, we’ll walk you through how to read and use these charts effectively, whether you’re a beginner building your skills or an advanced player refining your edge. What Is a Texas Hold’em Chart? A Texas Hold’em chart is a visual or tabular tool showing you how to evaluate your hand strength, pre-flop actions, and probabilities. There are several types of charts used in poker, and the two most popular are: Chart of Starting Hands Odds Chart for Post-Flop Play These tools allow players to assess the value of their hands and make mathematically sound decisions, especially under pressure. Looking for downloadable charts? Visit PokerStrategy.com and Upswing Poker for printable guides. Texas Holdem Chart Hands: Understanding Starting Hand Charts A Texas Holdem chart of hands categorizes all 169 unique pre-flop combinations in a 13×13 grid. These hands include: Pocket Pairs (e.g., AA, 88) Suited Hands (e.g., A♥K♥, Q♦J♦) Off-suit Hands (e.g., K♠J♣) The grid is often color-coded to help players quickly determine which hands to raise, call, or fold depending on position at the table. Sample Chart Breakdown: Hand Type Action Example Premium Hands Raise any position AA, KK, AKs Strong Hands Raise/call in most positions QQ, JJ, AQs Medium Hands Raise in late position KQ, AJ, 99 Weak Hands Fold unless in blinds J9o, 55, Q8s These Texas Holdem chart hands are most useful in pre-flop decision-making and can dramatically reduce poor hand selections. Position-Based Use of Chart Hands Position plays a critical role in Hold’em strategy. The later your position, the wider your playable hand range should be. Most starting hand charts include columns for: Early Position (UTG, UTG+1) Middle Position (MP) Late Position (CO, BTN) Blinds (SB, BB) Example: In early position, play only AA–JJ, AKs, AQs. In late position, add more speculative hands like 76s, QTs, and small pocket pairs. Check out BlackRain79’s hand guide for a full list of starting hands by position. What Is a Texas Hold’em Odds Chart? A Texas Hold’em odds chart provides probabilities for various outcomes during a hand, like hitting a flush, improving a pair, or winning with a certain hand vs. another. These charts are essential in: Post-flop calculations All-in situations Draw analysis (flush, straight, etc.) Why Use an Odds Chart? Odds charts allow you to: Estimate your chances of winning a hand Make correct calls or folds based on pot odds Identify profitable vs. unprofitable bluffs Odds charts complement chart hands by giving you data to support in-game choices after the flop, turn, and river. Common Texas Hold’em Odds Chart Scenarios Here are some of the most valuable odds from standard Texas Hold’em charts: 1. Odds of Hitting a Pair on the Flop Starting hand: two unpaired cards Odds: ~32% (roughly 1 in 3) 2. Odds of Completing a Flush Flush draw (4 suited cards) on the flop Odds to hit flush on turn or river: ~35% 3. Odds of Hitting a Straight Open-ended straight draw (e.g., 6-7-8-9) Odds to hit by river: ~31.5% 4. Set Mining Odds Start with a pocket pair, hit a set on the flop Odds: ~11.8% (about 1 in 8.5) Pot Odds vs. Hand Odds To apply odds charts in real hands, you must understand pot odds—the ratio between the current pot size and the cost of a call. Example: Pot: $100 Opponent bets: $50 You need to call $50 to win $150 → Pot odds = 3:1 Compare this to your hand odds. If your draw completes 1 in 4 times (25%), then 3:1 pot odds make it a break-even call. Learn how to calculate pot odds from PokerNews. Using Odds Charts with Drawing Hands Odds charts shine in situations where you’re chasing a draw. Example: You hold A♦J♦, and the flop comes 2♦ 6♦ Q♣. You have a flush draw. Odds of hitting a diamond: On the turn: 9 outs / 47 unseen cards ≈ 19.1% On the river (if missed turn): 9 outs / 46 ≈ 19.6% Combined turn + river chance ≈ 35% If your opponent bets the right amount, you can use this data to decide whether to call, raise, or fold based on pot odds. Pre-Flop Hand vs. Hand Odds (Heads-Up) Use Texas Hold’em odds charts to compare specific hand matchups: Your Hand Opponent Hand Win % AA KK 81% AKs QJs 63% 77 AKo 54% KQ KJ 75% AQ 22 47% Use PokerStove or Equilab to simulate real hand ranges. Printable Texas Hold’em Odds and Hand Charts Looking to download or print cheat sheets for home games or online grinding? Here are trusted resources: Upswing Poker’s Pre-Flop Charts PokerStrategy’s Odds Cheat Sheet The Poker Bank’s Starting Hand Rankings You can tape these charts next to your screen or print them for live play until they become second nature. Tips for Using Charts Effectively Study in low-pressure environments (like free games or home games) Review hands post-game using charts Customize your charts as you develop your style Combine odds with player reads — charts don’t replace psychology Don’t over-rely: real poker involves adjusting to live table conditions Conclusion: Combining Chart Hands and Odds for Poker Mastery If you’re serious about improving your Texas Hold’em game, combining Texas Hold’em chart hands with a detailed odds chart gives you a powerful, data-driven approach. These tools reduce mistakes, improve consistency, and help you develop a profitable strategy for both cash games and tournaments. Key Takeaways: Use hand charts to know what to play pre-flop Use odds charts to decide post-flop actions Always compare pot odds to drawing odds Update your chart usage based on table dynamics Poker may be part luck—but long-term success belongs to those who understand math, probabilities, and disciplined strategy.
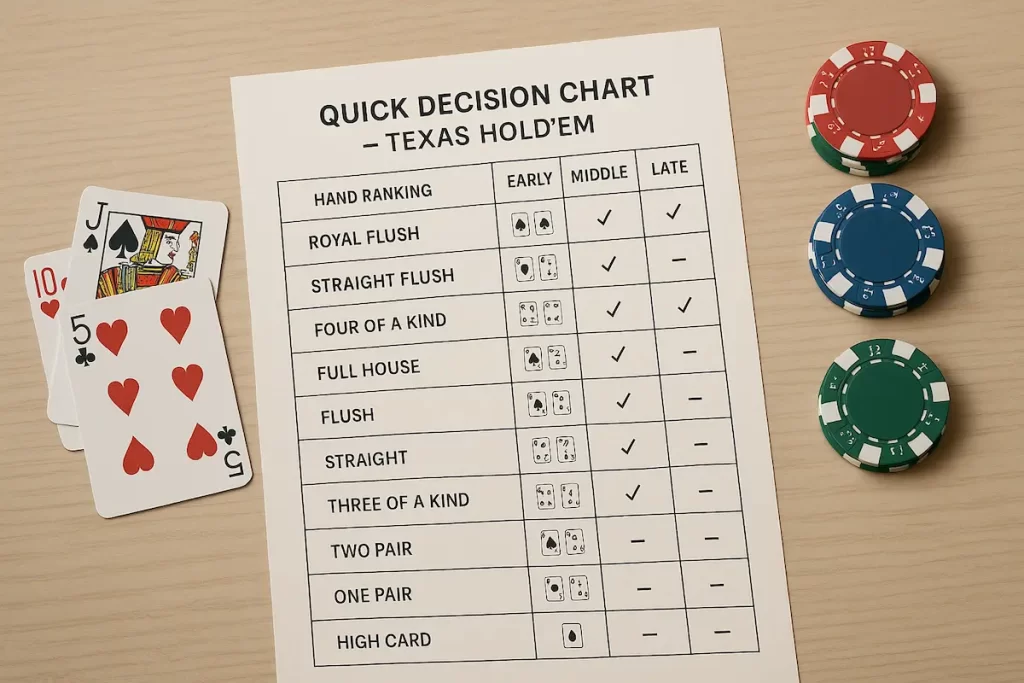
Texas Hold’em Charts for Beginners: How to Read and Use Them
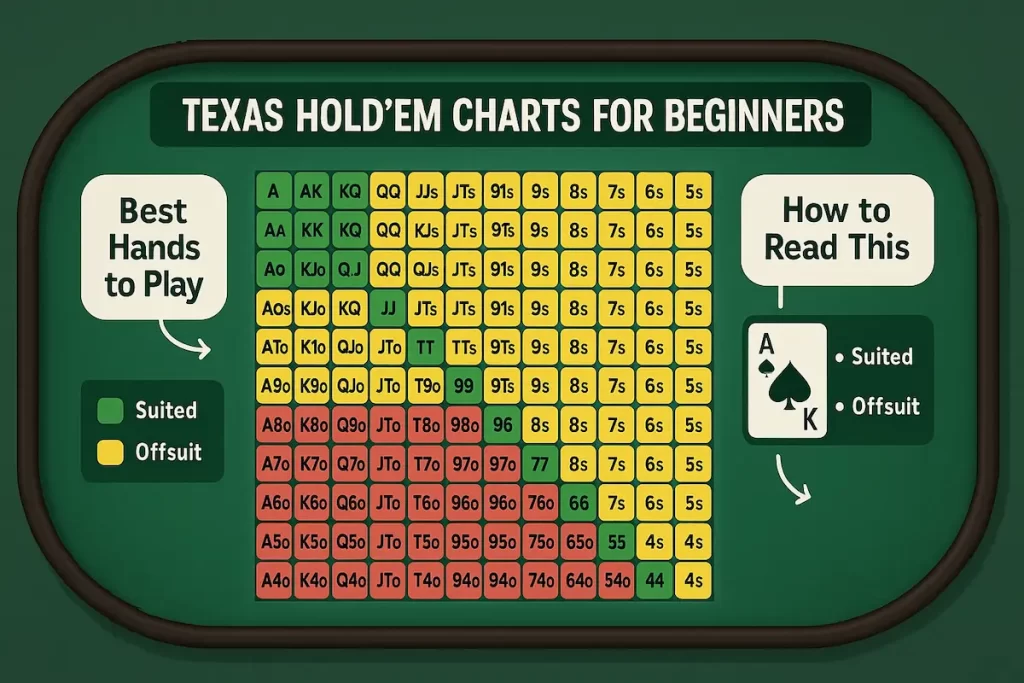
Texas Hold’em is one of the most popular poker variants in the world, played in casinos, tournaments, and online platforms alike. Whether you’re a beginner or an aspiring pro, understanding and using Texas Hold’em charts is key to making smarter decisions and boosting your win rate. In this guide, we’ll break down what Texas Hold’em charts are, how to use them effectively, and provide an in-depth look at Texas Hold’em chart hands, complete with hand rankings and strategy charts that help you play like a pro. What Are Texas Hold’em Charts? A Texas Hold’em chart is a visual representation of poker hands and strategies, used to guide decision-making during the game. These charts help players quickly determine the strength of their hand and whether to fold, call, raise, or go all-in, especially during pre-flop play. Common Types of Texas Hold’em Charts: Starting Hand Charts Position-Based Hand Charts All-in or Push/Fold Charts EV (Expected Value) Charts Range Charts for Opponent Profiling Each type of chart serves a different purpose, depending on your skill level and table dynamics. Want to download free printable charts? Try Upswing Poker or PokerStrategy.com for beginner-friendly PDFs. Why Use a Texas Hold’em Chart? Poker is a game of strategy, not guesswork. Using Texas Hold’em charts helps reduce emotional decisions and encourages mathematical consistency. The biggest benefits include: Knowing which hands to play in each position Avoiding weak starting hands Identifying profitable spots to bluff or fold Improving long-term expected value (EV) Minimizing mistakes in high-pressure moments Whether you’re in a live game or grinding online tournaments, having a Texas Hold’em hand chart at your fingertips increases confidence and discipline. Texas Hold’em Chart Hands: Understanding Starting Hand Rankings What Are Starting Hand Charts? A starting hand chart lists all 169 possible starting hand combinations in Hold’em (13 ranks × 13 ranks) and classifies them by strength and playability. These combinations fall into three categories: Pocket Pairs (e.g., AA, TT, 55) Suited Hands (e.g., A♥K♥, J♠10♠) Off-suit Hands (e.g., A♣K♦, Q♠J♦) Sample Texas Hold’em Starting Hand Chart: Hand Type Playability AA, KK, QQ Premium — Always raise JJ, TT, 99 Strong — Raise or call AKs, AQs, KQs Very strongly suited — Open from any position AJo, KQo Medium strength — Play from the middle or late position 76s, 54s Suited connectors — Use in late position or as a bluff Note: “s” = suited, “o” = off-suit For a detailed look at all starting hands, visit PokerListings’ Starting Hand Chart. Position-Based Texas Hold’em Charts In poker, position is power. The later your position at the table (closer to the dealer button), the more information you have before acting. Texas Hold’em hand charts change depending on your position: 1. Early Position (EP) – Tight Range Only play premium hands (AA–TT, AKs, AQs) 2. Middle Position (MP) – Slightly wider range Add hands like AJ, KQ, QJs, 99, 88 3. Late Position (CO, BTN) – Looser Range Play suited connectors, small pairs, suited aces (A9s, A8s), and bluff occasionally 4. Blinds (SB, BB) – Defensive and aggressive mix Defend wide in BB, open tight in SB Chart hands for each position helps structure your gameplay and improve your pre-flop strategy. Push/Fold Charts: Perfect for Short-Stacked Play When your chip stack drops below 10–15 big blinds, you enter the push/fold zone. In this scenario, using a push/fold chart can be the difference between survival and busting out. These charts show you: Which hands to go all-in with When to fold based on stack size and position For example: From the Button with 10 BB, shove with: 22+, A2+, K8+, Q9s+, JTs From Early Position with 8 BB, shove only: 66+, A9+, KQ Download tournament push/fold charts from PokerNerve for free. Equity and Range Charts: Advanced Usage Advanced Texas Hold’em players study equity and ranges using specialized charts or poker solvers. What is Equity? Equity is your hand’s percentage chance to win at showdown against an opponent’s range. For example: AK suited vs 99 → ~46% equity AQ off-suit vs JJ → ~30% equity Range Charts Range charts are used to assign possible hands to opponents based on their actions (e.g., 3-bet, call, fold). Tools like Equilab and Flopzilla visualize these ranges for optimal play. These advanced tools complement Texas Hold’em chart hands and allow deep analysis of any situation. How to Read and Use a Texas Hold’em Chart A standard Texas Hold’em hand chart is structured as a 13×13 grid with rank combinations along the axes (2 through Ace). Chart Reading Example: Top-left (AA) = Pocket Aces (always raise) Bottom-right (22) = Pocket Twos (play selectively) Diagonal = Pocket pairs Above diagonal = Suited hands (e.g., A♠K♠) Below diagonal = Off-suit hands (e.g., A♣K♦) Color-coded guides often use: Green: Strong hands → Raise Yellow: Medium hands → Call or raise in late position Red: Weak hands → Fold Once you memorize chart colors and positions, reading hand ranges becomes second nature. Printable Texas Hold’em Charts: Where to Find Them Here are reliable places to find free, printable Texas Hold’em hand charts: Upswing Poker Charts PokerStrategy.com Beginners Charts BlackRain79 Starting Hands Guide These resources include charts for cash games, tournaments, and position-specific strategies—ideal for all levels. Common Mistakes When Using Texas Hold’em Charts Relying too strictly on charts without adapting to table dynamics Ignoring opponent tendencies or table image Using outdated or overly conservative charts Misunderstanding suited vs. off-suit hands Texas Hold’em charts are tools, not absolute rules. Combine them with experience and observation for best results. Final Thoughts: Why Every Player Should Use Texas Hold’em Charts Texas Hold’em is a blend of math, psychology, and timing. No matter your skill level, having a solid foundation in Texas Hold’em chart hands improves your decisions and reduces costly errors. To recap: Texas Hold’em charts guide pre-flop and post-flop strategy Starting hand charts help choose playable hands Push/fold charts are essential in short-stack tournament play Position-based charts help exploit player advantage Advanced players use range and equity charts for deeper strategy Charts simplify